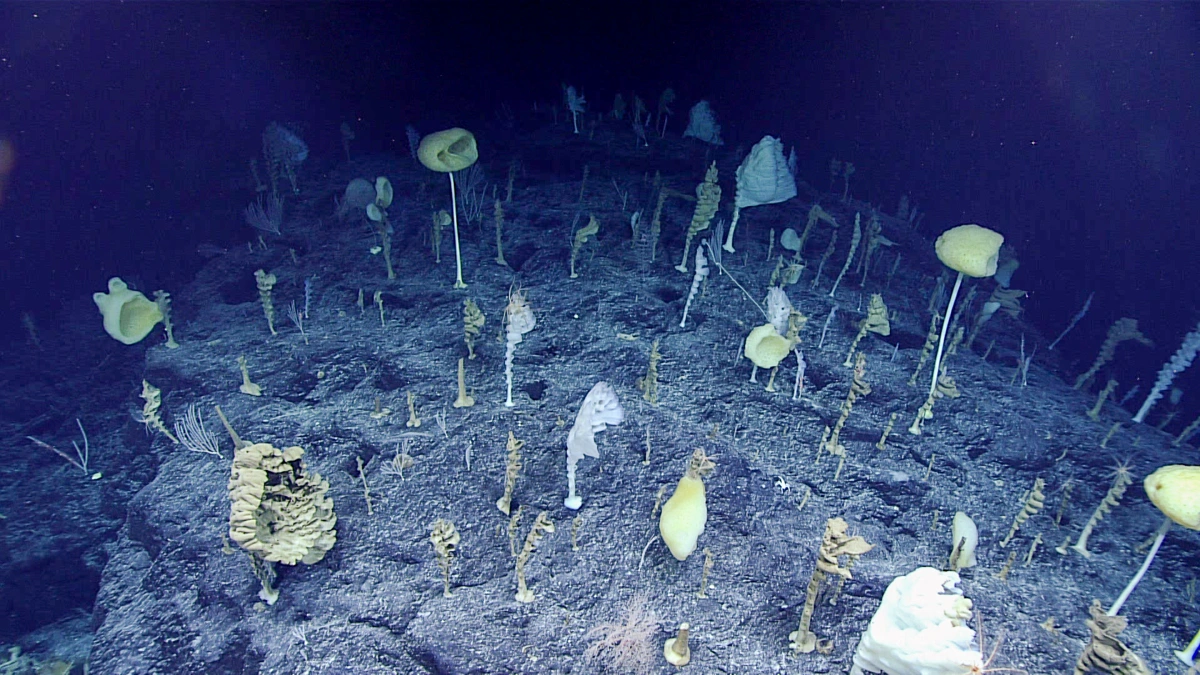
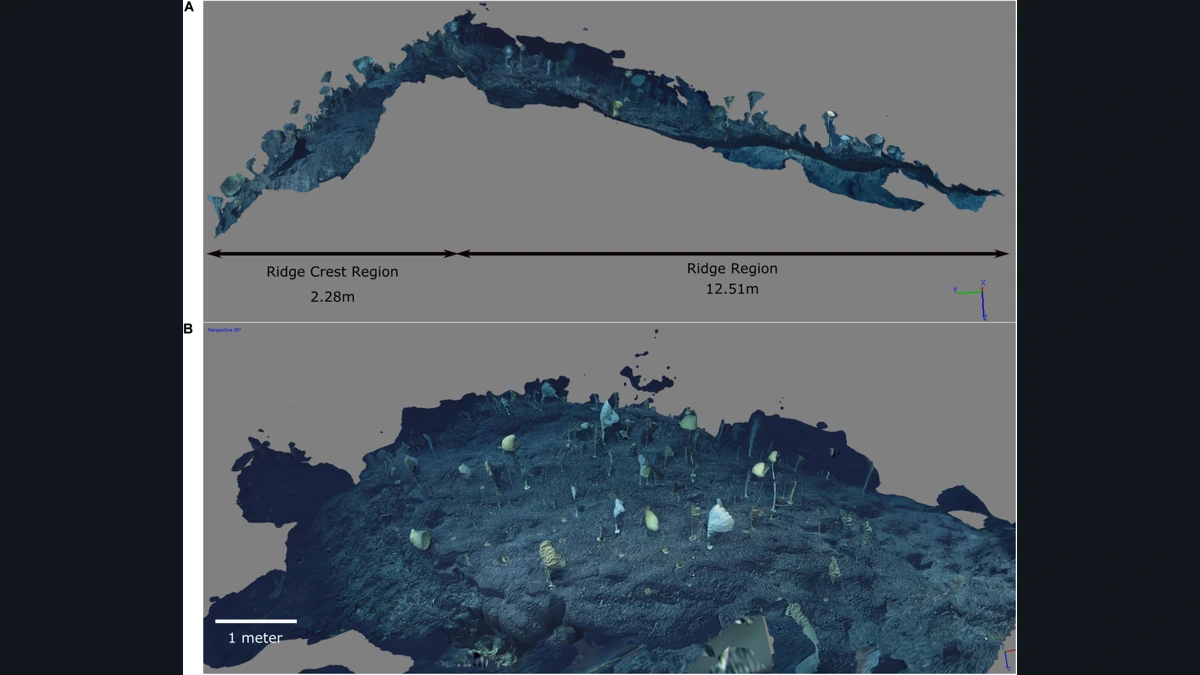
In footage from the Pacific seafloor, sponges rise on stalks and many appear to face the same way. The remotely operated vehicle Deep Discoverer filmed the community in 2017 on a seamount known as Ridge, in the Johnston Atoll region. In 2020, Emily Mitchell and Simon Harris used part of that footage to reconstruct a stretch of seabed in three dimensions. This was not a return visit. It was a way to extract measurements and relationships from an older dive that were harder to see in a video played in sequence.
That distinction mattered again in November 2026, when NOAA completed a technology demonstration involving autonomous underwater vehicles. The annual expedition plan mentioned Johnston, but the page for the completed mission puts the trials off Hawai‘i. It does not confirm that the sponge community was filmed again. The documents describing the mapped section of Ridge remain the footage from 2017 and the study published three years later.
A community that looks like a forest
NOAA calls the scene the Forest of the Weird. The nickname captures an impression, not a scientific classification. Glass sponges are animals, not plants. Fixed to the seabed, they take food from the water and have structures made of silica in their skeletons. Corals also appear in the images and were recorded in the survey. The apparent forest was not made up of a single species.
Many of the sponges were similarly oriented relative to the current. That is a pattern viewers can recognise in the footage. Explaining why the animals were concentrated on a particular part of the ridge is a different task. It requires asking how the organisms were distributed in relation to one another and how much of the seabed the footage actually captured.
From overlapping frames to a model of the terrain
As the vehicle moves along a slope, it sees the same patch from slightly different angles. In photogrammetry, points recognisable in overlapping frames are used to estimate where surfaces are located. A stone that shifts across the screen as the camera moves is not moving on the seabed. The change in perspective helps establish its position relative to nearby features.
The result preserves something a single photograph cannot: the form of a stretch of terrain that can be approached, viewed from the side and examined again. The team could place the identifiable organisms in the model and map their positions. Footage played in order can reveal which sponge the camera encountered first. A map can reveal which sponges were close together even when they appear at different points in the recording.
Which depth belongs to which part of the dive?
The community mapped in the paper lies at depths of 2,365 to 2,370 metres. That is the depth of the reconstructed section, not the deepest point reached by the vehicle or a figure for every part of the seamount. The dive travelled through more of the area than the authors used in their analysis. Without a description of the patch, two depth figures can look as if they contradict one another when they refer to different places.
The researchers distinguished a gentler ridge section from a steeper patch near the crest. There were more organisms per unit of area in the steeper part of their map. That is a result for the sample, not proof that the entire crest is more densely populated than every stretch around it.
Where the model gets things wrong
The reconstruction contains dark blue areas above the ridge. According to the authors, they are artifacts produced where frames included distant background, not blue structures suspended over the sponges. Another patch was poorly resolved because the available footage did not cover it sufficiently. A missing detail there tells us about the video available for the reconstruction. It is not evidence of a gap in life on the seabed.
That is a good reason to show the model and the original dive image together. The dive image records what the community looked like. The reconstruction shows what could be measured and where the method ran up against the limits of the footage. Together they make it harder to mistake a well-rendered scene for complete coverage.
What it would take to show that the community has changed
The mapping study can tell us about neighbours, densities and orientation in a local patch. It does not tell us how the community has changed since 2017. Measuring change would require revisiting the same area with comparable coverage and distinguishing a missing animal from one that simply fell outside the camera’s view. The Hawai‘i trial is news about exploration tools. The Johnston example shows what those studying the ocean can learn by taking a second look at footage from a single pass.
See the 2017 dive
NOAA’s archive shows the original footage and a photograph from Ridge Seamount in the Johnston Atoll region.
Becoartes - Beco do Batman
99 Gonçalo Afonso Street, Vila Madalena, São Paulo
Sources and credits
- NOAA Ocean Exploration, 2017 Laulima O Ka Moana — Public domain (NOAA Ocean Exploration)
- Emily G. Mitchell and Simon Harris (2020), Frontiers in Marine Science, Fig. 2, DOI 10.3389/fmars.2020.565171; resized and padded; no crop. — CC BY
- NOAA, vídeo do Ridge
- NOAA, missão EX2701 concluída
- NOAA, planejamento anual 2026