One frame shows a shallow circle on the seabed. The next shows several, some close enough together to trace a curve. A camera can capture the outline but cannot establish the size of a hollow on its own. Two points of light set ten centimetres apart took care of part of that problem. They were mounted on Lassie, a remotely operated vehicle that surveyed the western Weddell Sea off Antarctica. The footage was collected in 2019; the analysis of the nests appeared in Frontiers in Marine Science in October 2025.
A ruler where a tape measure would not work
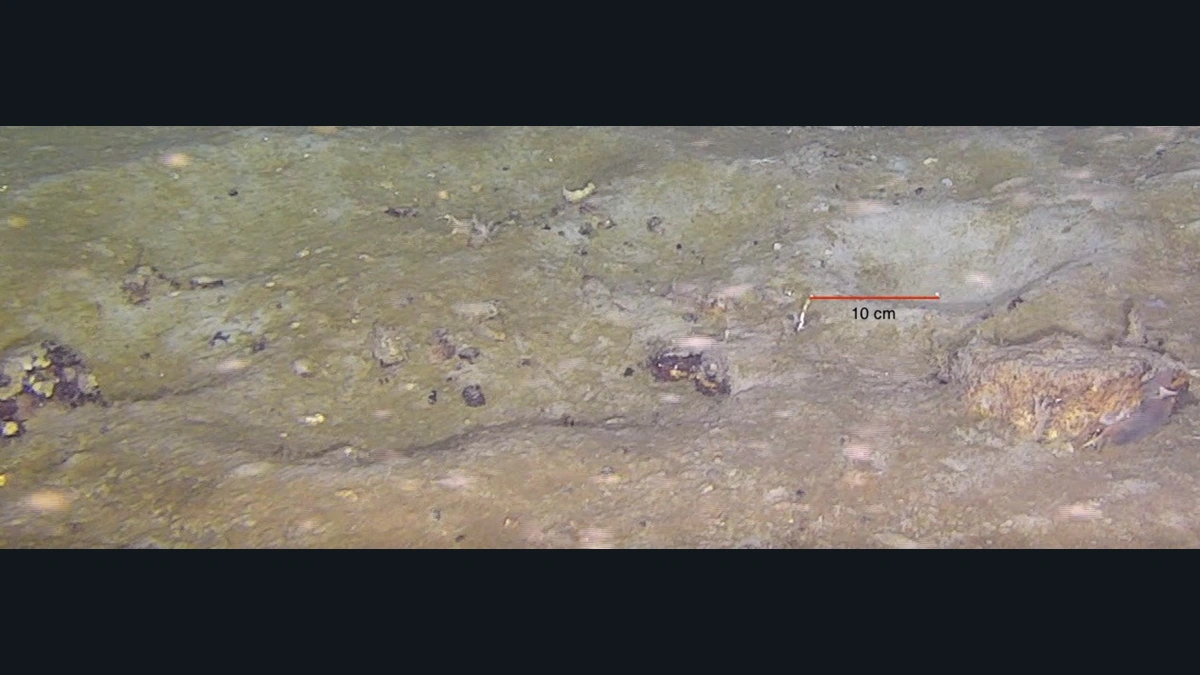
When a camera moves away, everything looks smaller. Move it closer and a small circle can fill the screen. Rather than confuse changes in distance with changes in the size of the nests, the researchers used the known gap between the two laser dots as a scale. In a figure from a location they called Site D, they marked the gap with a red line to make that ten-centimetre reference easy to identify.
The team reviewed the video, took stills where depressions were visible, and logged the time in the recording, depth and location. They measured the outlines and noted nearby material such as shells and stones. Hollows smaller than 6.5 centimetres were left out. That cutoff matters when comparing surveys. A tally depends not only on what sits on the seabed, but also on what investigators decide can qualify for the tally.
What came into view on five dives
The team collected about 27 hours of footage at five sites. It documented more than a thousand nests at depths ranging from 290 to 411 metres. It did not count a thousand randomly chosen squares of equal area. The vehicle followed survey tracks, and the sites had been selected to represent places with different histories of ice cover.
Most nests were shallow rounded depressions with a rim of raised sediment. The mean recorded diameter was 12.3 centimetres, so the distance between the dots was nearly the width of an average nest. The scale was useful for objects visible in the footage. It could not show how large the whole nesting area was from a single example or still image.
A layer of sediment helped sort the nests
A plankton bloom before the survey had left loose material on the seabed. The team used the presence or absence of that material inside the depressions to classify them. If it had settled in the hollow, the nest was treated as abandoned; if the interior was clear of the deposit, it was counted as maintained. The paper places the two cases side by side in a figure from the same site.
Calling a nest active in this context describes how it looked and how the researchers interpreted that appearance. It does not mean the video showed a fish tending the rim. The difference matters. A sign in the sediment is evidence from which to draw an inference, not a direct recording of the activity suggested by that sign.
Which fish appeared in the circles?
The only fish species seen inside the nests was Lindbergichthys nudifrons, making it a likely builder. Larvae appeared in or around some nests. No eggs or fish digging the hollows were observed. The team raised the possibility that the expedition had taken place after the usual hatching period.
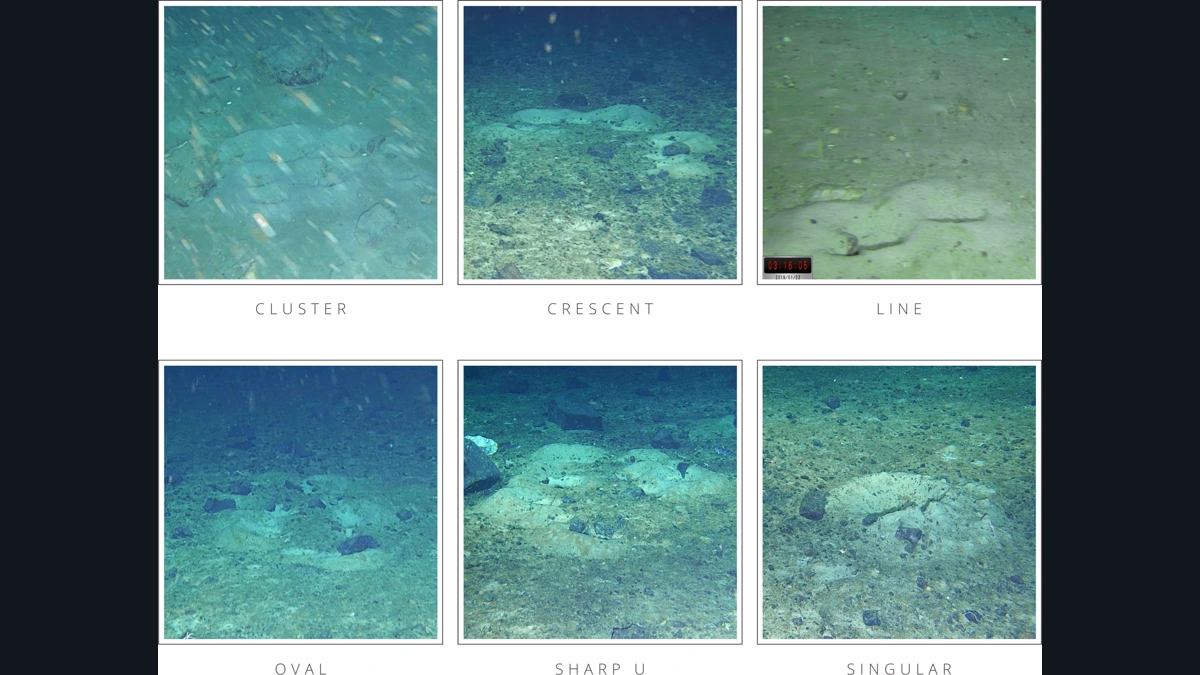
In the footage, the circles appeared alone or in clusters, crescents, lines, ovals and close U shapes. Naming a pattern is not the same as demonstrating why it formed. To establish that the fish coordinated to form a crescent, for instance, researchers would have to watch the shape take form rather than recognise it once it was already there.
What a return dive could test
The footage shows five stretches of the western Weddell Sea. It does not yield a count for the entire sea. Nor should this work be confused with the much larger colony of another species that an Alfred Wegener Institute team studied farther south. Depth, site and species all matter: the resemblance between two circles in two images does not make the surveys equivalent.
The value of the ten-centimetre scale is that another team could use it. A second visit to the same sites, in a different season, could apply the same size cutoff, scale and criteria for identifying the deposit. A comparison on those terms could begin to separate an actual change on the seabed from an apparent change caused by a camera passing at a slightly different distance. The dots help make the measurement repeatable; what comes into view on the next visit would still depend on the survey.
Compare the nests
Figure 2 of the study shows how researchers distinguished hollows covered by deposits from those that were clear.
Becoartes - Beco do Batman
99 Gonçalo Afonso Street, Vila Madalena, São Paulo