El Niño is strengthening and is already shaping seasonal odds for the United States winter. The official outlook favors wetter conditions across much of the South and parts of both coasts, along with above-normal temperatures across broad areas of the North and West. It still cannot determine whether a city will get snow, flooding, drought, or a cold wave.
What NOAA has confirmed
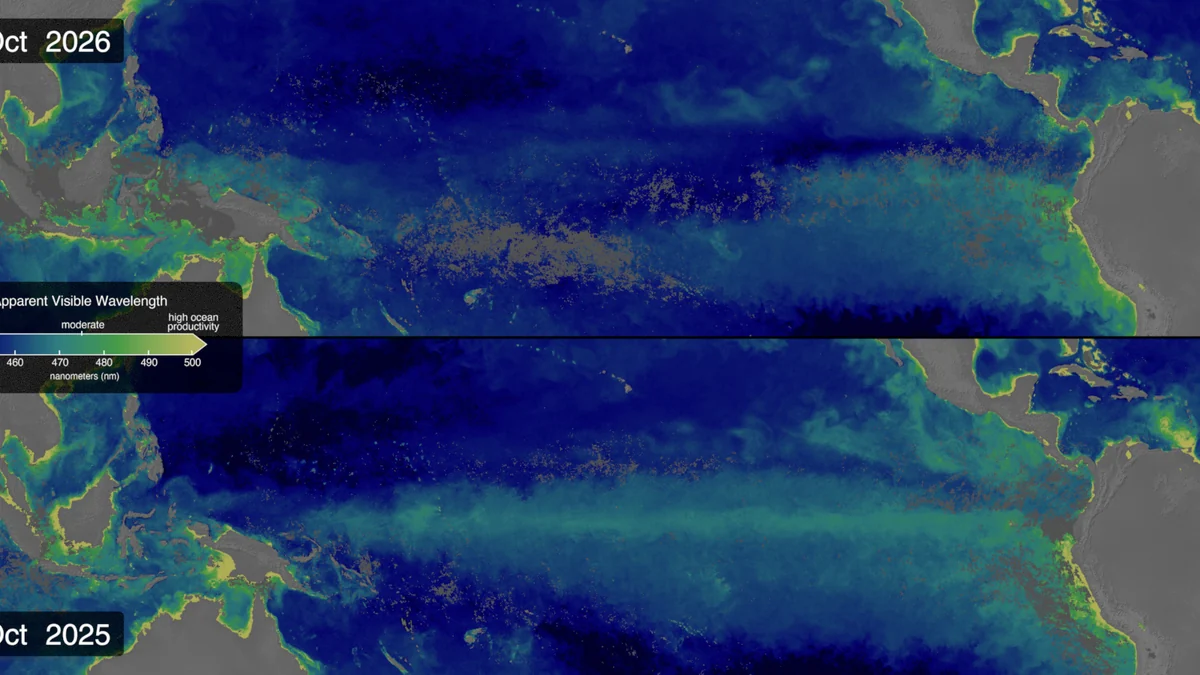
In its November 12, 2026 discussion, the Climate Prediction Center (CPC) maintained an El Niño Advisory. The agency said the event continued to strengthen and assigned a greater than 79% probability to a strong-to-very strong El Niño during January–March 2027.
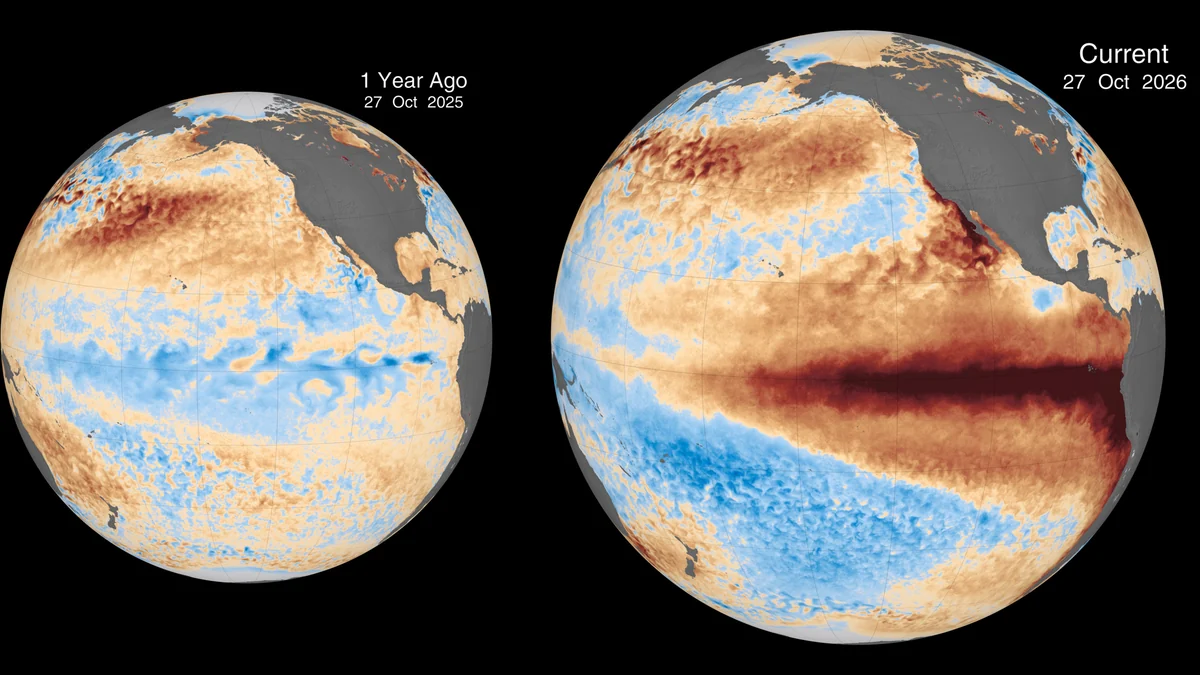
Monitoring found a +2.5°C anomaly in the Niño-3.4 region, with higher values in the eastern equatorial Pacific. Above-average subsurface heat, wind changes, and enhanced rainfall from the central to eastern Pacific showed the ocean and atmosphere responding as a coupled system, according to the CPC diagnostic discussion.
The CPC also estimated about a 60% chance that the event would reach a historic threshold—a three-month RONI value of at least +2.5°C—during the October–December and November–January periods. That is not a forecast of record impacts in every state.
The regional winter outlook
The CPC’s seasonal discussion, issued October 15 and still current on November 15, describes the outlook for November 2026 through January 2027:
- Above-normal temperatures favored: eastern Alaska, the western third of the contiguous United States, the northern tier, southern Florida, the Ohio Valley, and the Mid-Atlantic. The highest odds are in Southeast Alaska, the upper Mississippi Valley, and the Great Lakes.
- Near-normal temperatures favored: much of the Southeast. The Southwest and parts of the southern Plains have equal chances among the three categories.
- Above-normal precipitation favored: much of California and the Southwest, the central and southern Plains, the lower Mississippi Valley, the Southeast, and the Eastern Seaboard. The strongest signal is in the Southeast and Florida; odds exceed 70% in parts of the extreme Southeast and northern Florida through January–March 2027.
- Below-normal precipitation favored: much of interior Alaska, the northern Rockies and High Plains, and parts of the Great Lakes.
These categories describe a seasonal mean or total. “Above normal” does not say which week will be wet, whether precipitation will fall as rain or snow, or whether flooding will occur. White or “equal chances” areas do not guarantee normal weather; they mean no category has a clear probability advantage.
Strength is not a city forecast
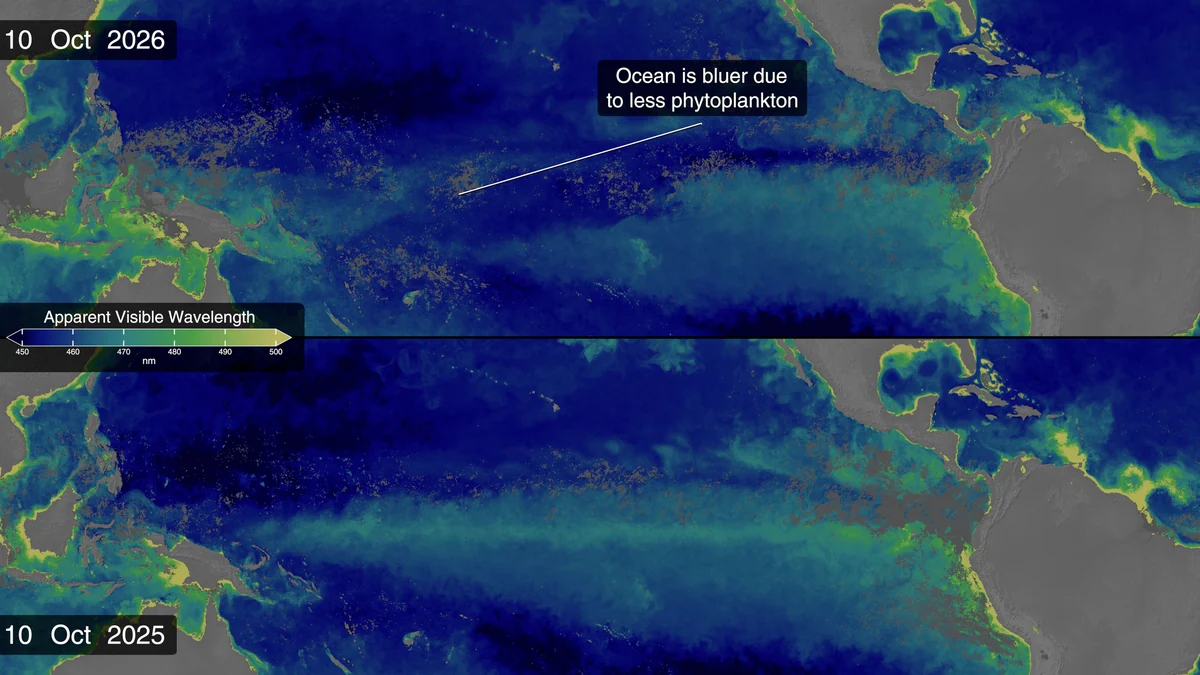
Three different scales matter. An ENSO diagnosis identifies whether El Niño is present and how strong it may become. Seasonal outlooks shift temperature and precipitation odds across broad areas over several months. A local forecast tracks specific weather events over the coming days.
The bulletin therefore cannot determine individual storm tracks, cold-wave dates, city snowfall totals, or whether flooding will occur. NOAA also stresses that even with a very strong El Niño, consistent impacts become more likely but are not guaranteed.
The CPC ENSO portal brings together weekly conditions, official strength probabilities, and historical analyses. Those records help identify tendencies; they do not automatically reproduce a previous winter.
Which product to use
To follow the event’s strength, use the monthly diagnostic discussion and the CPC’s weekly conditions. For planning over weeks or months, consult the seasonal outlook maps and check the valid period, variable, and issue date. The next monthly outlook update was scheduled for November 19, 2026, so the maps may change after this article is published.
For travel, schools, outdoor work, or property protection, use the local National Weather Service forecast and active alerts. The NWS safety center provides guidance for cold, winter weather, floods, wind, and other hazards. Some floods can be anticipated days or weeks ahead, while flash floods can develop within minutes.
The practical takeaway is specific: a strong El Niño shifts the seasonal odds, especially toward a wetter South and warmer conditions across broad parts of the North and West, but it does not forecast a city’s weather. Use the ENSO diagnosis for the event, CPC maps for regional tendencies, and the local NWS for immediate conditions and hazards.
Discover Becoartes
Visit [Becoartes](https://becoartes.com/) at Rua Gonçalo Afonso, 99, Vila Madalena, São Paulo.
Becoartes - Beco do Batman
99 Gonçalo Afonso Street, Vila Madalena, São Paulo
Sources and credits
- NASA's Scientific Visualization Studio - Science and Technology Corporation/Kel Elkins, SSAI/Morgaine McKibben, GSFC/Matthew Kehrli — Public domain
- NASA's Scientific Visualization Studio - Science and Technology Corporation/Kel Elkins — Public domain
- NASA's Scientific Visualization Studio - Science and Technology Corporation/Kel Elkins, JPL/Josh Willis, NASA/GSFC/Peter H. Jacobs, SSAI/Morgaine McKibben, GSFC/Matthew Kehrli, Telophase Corp/Erica McNamee, NASA/JPL/Sally Younger, Telophase/Jenny Marder Fadoul — Public domain
- NOAA Climate Prediction Center — ENSO Diagnostic Discussion
- NOAA Climate Prediction Center — ENSO forecasts
- NOAA Climate.gov — ENSO Blog
- www.cpc.ncep.noaa.gov
- National Weather Service — weather safety
- www.cpc.ncep.noaa.gov