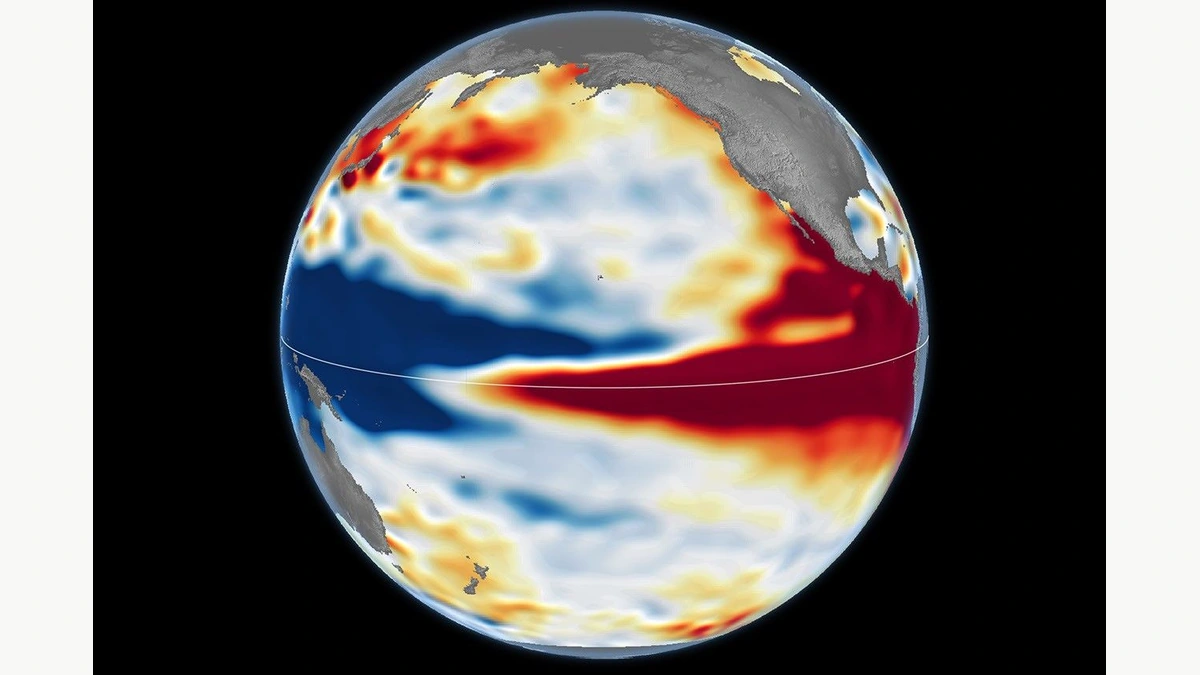
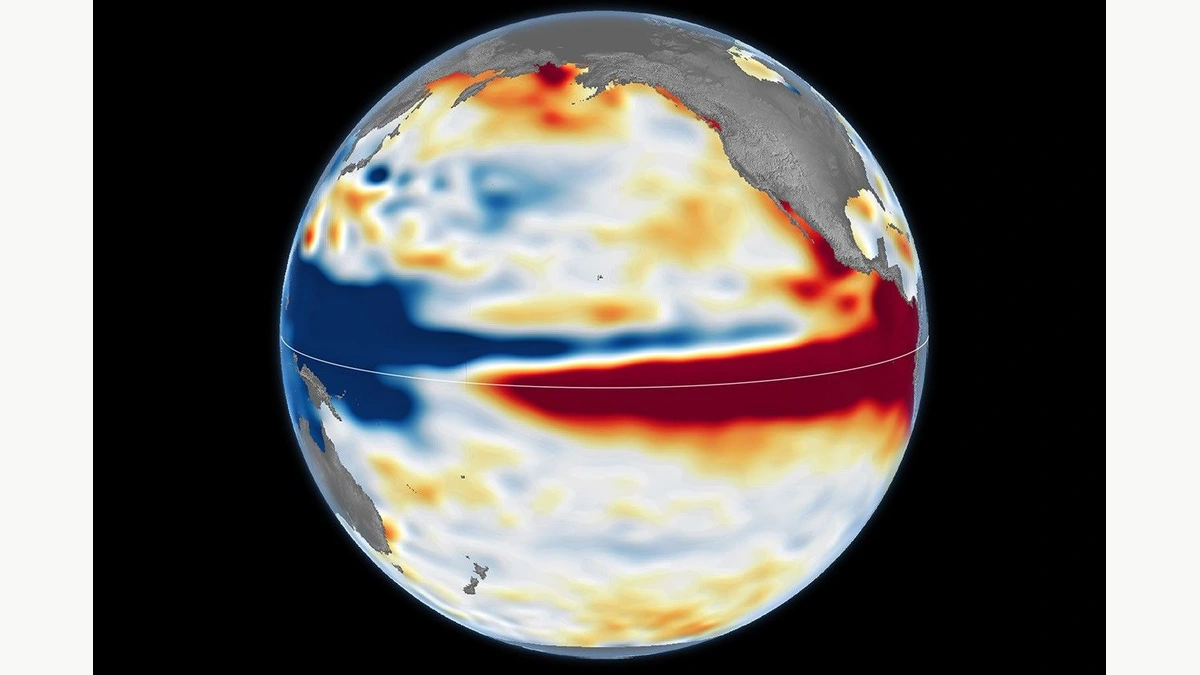
A red band reaches South America in NASA’s October map of the Pacific. In a November bulletin from the Geological Survey of Brazil, ten downward arrows appear beside river stations in the Rio Branco basin. Both pictures matter to the northern Brazilian state of Roraima. But the red does not mean a shortage of rain in Boa Vista, the state capital, and the arrows do not say how many centimetres the river will fall. To understand the local warning, start with the gauge.
The survey’s special bulletin, with a reference date of November 16, 2026, covered ten stations, from Uiramutã to Caracaraí. The station named Boa Vista is number 14620000. It is not the same as Fazenda Passarão, another station within the municipality. That distinction matters when following a river from week to week. Gauge height is measured against a reference point at the station. It is not the distance from the surface to the bed in the middle of the channel.
What stood out at the ten stations
Falling water is part of the seasonal cycle. What concerned the survey was not that water was receding in November, but that levels were already exceptionally low for that time of year. The near-term outlook pointed down at all ten stations. That does not mean identical declines at ten locations. An arrow gives the expected direction, not the speed of change or the date on which a river will reach its lowest level.
The bulletin also considered the months ahead. Most models projected less rain than usual from November through February, months that normally have little rainfall to begin with. In the survey’s assessment, the combination could extend the period of falling water into February 2027. Some models suggested wetter conditions starting in March. But the models also disagreed more at that distance. March was not a promised recovery date.
What the satellites measure across the Andes
NASA’s colours describe the height of the ocean surface relative to average. Red means higher water, not a temperature in degrees. The connection to heat arises because water expands as it warms. Winds also help determine where that warm water goes: when the winds that usually push it west weaken, warm water can travel east across the equatorial Pacific.
The maps for October 13, 1997, and October 12, 2026, show elevated water extending towards South America in both years. During another strong event in October 2015, less of that elevated water reached the coast. Researchers remove signals such as seasonal variation to make these contrasts visible. These are measurements made comparable across different satellite missions, not photographs of an ocean that has actually turned red.
How to compare two readings from one gauge
Take two consecutive readings at the same gauge. The second may be lower than the first and still be high for the month: the starting point may have been well above normal. The opposite can also happen. A small rise after a long decline does not necessarily bring the river back into the range typical of that station for the season. The direction of the most recent change and the position of the water level in the historical record answer different questions. That is why the bulletin provides both kinds of information rather than simply stating whether the last reading was higher or lower.
Why October does not predict a particular day in November
There is a difference in timing as well. The Pacific map depicts one day in October; the Brazilian bulletin brings together observations and forecasts in November; its rainfall outlook stretches over several months. Treating all three as pictures of the same day throws away a useful part of the evidence. Less rain on average over a month does not rule out heavy rain on a particular day or in one part of the basin. A new daily measurement helps update the local picture. By itself it can neither confirm nor overturn a seasonal rainfall projection for the entire region.
Which document answers which question?
The Pacific map places the current El Niño alongside events observed from orbit. For the river outlook, turn instead to section 6.2 of the Brazilian bulletin. It brings together the rainfall outlook, station graphs and a table of expected trends. To find out what actually happened at Boa Vista after the forecast, look for subsequent observations at the same gauge. Comparing the forecast with those later readings tells a reader more about that stretch of river than watching a patch of the Pacific change colour.
Follow the river stations
Section 6.2 of the Brazilian bulletin locates the gauges and shows the expected direction of change at each station.
Becoartes - Beco do Batman
99 Gonçalo Afonso Street, Vila Madalena, São Paulo